

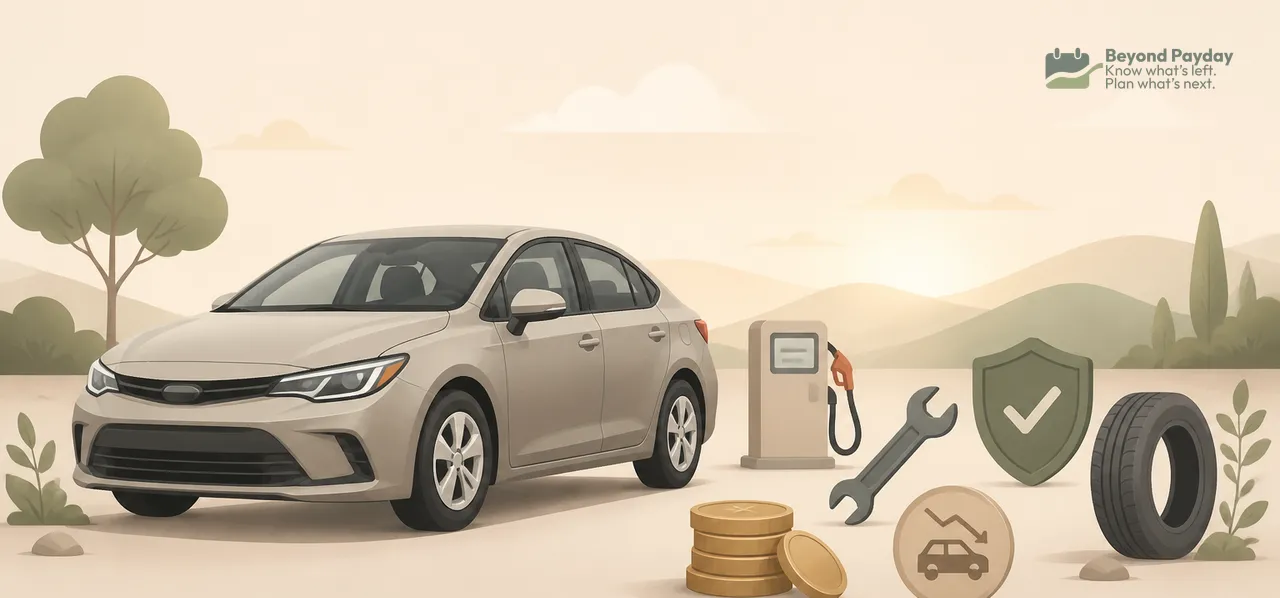
The loan payment is only one line on the real bill. AAA's 2026 Your Driving Costs study puts the average cost of owning and running a new car at $12,863 a year — about $1,072 a month — once insurance, fuel, maintenance, fees, financing, and depreciation are counted. Depreciation, the drop in what the car is worth, is the single largest piece, even though no one ever sends a bill for it.
- The average new car costs about $1,072 a month all-in, per AAA's 2026 study — far more than the payment suggests.
- Depreciation — the decline in the car's value over time — is the biggest single cost (about a third of AAA's total), even though it never appears as a line item.
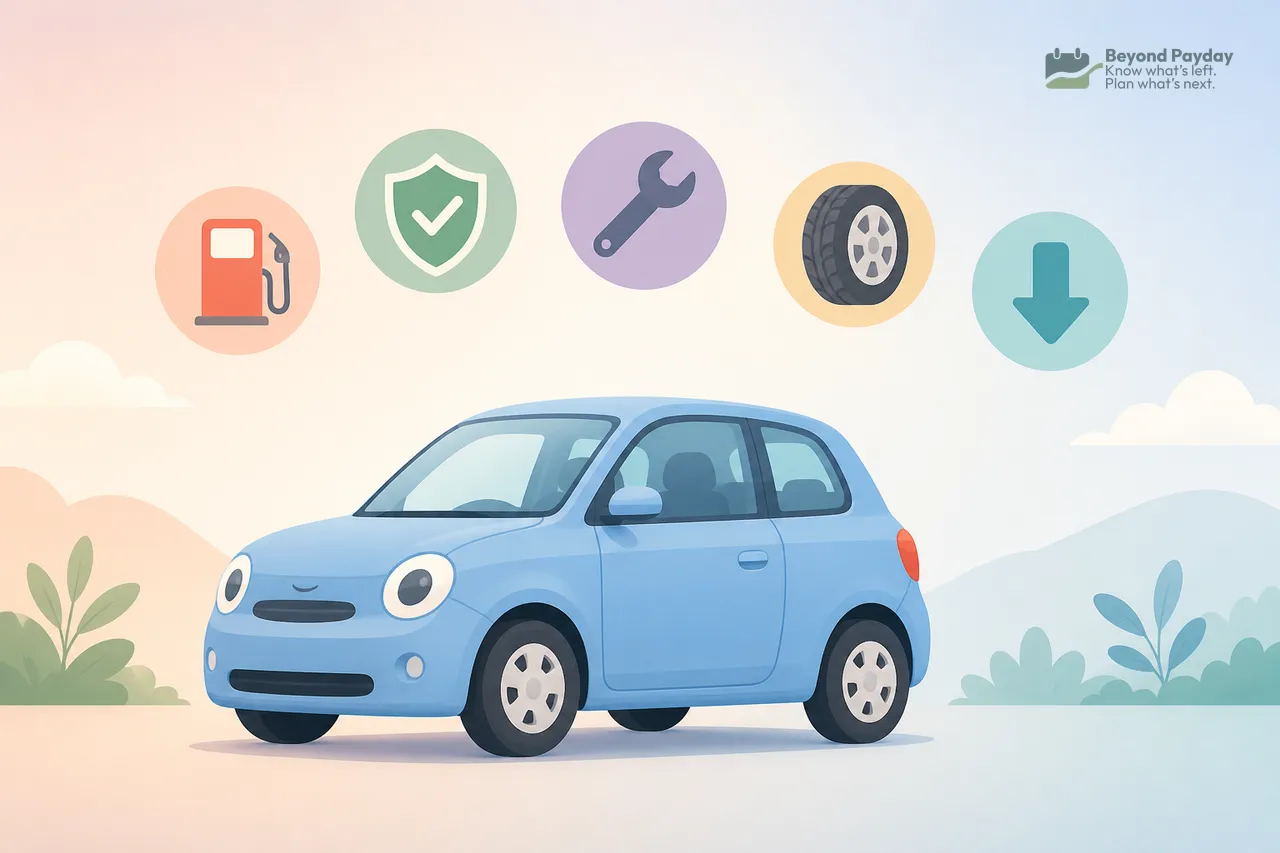
- Insurance, fuel/charging, maintenance, tires, registration, and parking add up long before depreciation is even counted.
- Rules of thumb about what share of income to spend on a car are useful starting points, not formulas that fit every situation.
- A longer loan term lowers the monthly payment but usually raises the total interest paid and the odds of owing more than the car is worth.
Everything the loan payment doesn't cover
A car payment covers the financing. It says nothing about what it costs to actually keep the car on the road.
- Insurance — premiums vary by driving record, location, the vehicle itself, and the coverage level chosen; they're due whether or not the car is driven much.
- Fuel or charging — gasoline costs shift with market prices and driving habits; electric vehicle charging costs depend on electricity rates and whether charging happens at home or at public stations.
- Routine maintenance — oil changes, filters, brakes, fluids, and scheduled services that come due on a mileage or time schedule regardless of budget.
- Tires — replaced every so many thousand miles; easy to forget until a set is suddenly due all at once.
- Registration and inspection fees — set by state and local governments, usually due annually or every couple of years, and they vary widely by location.
- Parking and tolls — can be a major recurring cost in dense cities and close to zero in other areas.
- Depreciation — the loss in resale or trade-in value over time, explained in more detail below.
Note
None of these costs is fixed. Two people with the identical car payment can have very different total costs depending on where they live, how they drive, and what insurance they carry.
What it adds up to
AAA's 2026 averages for a new vehicle, driven 15,000 miles a year and kept five years:
| Cost | Per year | Per month |
|---|---|---|
| Depreciation | $4,422 | ≈ $369 |
| Fuel (17.3¢/mile) | ≈ $2,595 | ≈ $216 |
| Insurance (full coverage) | $2,098 | ≈ $175 |
| Maintenance, repair & tires (11.7¢/mile) | ≈ $1,755 | ≈ $146 |
| Finance charges (interest) | $1,184 | ≈ $99 |
| License, registration & taxes | $802 | ≈ $67 |
| Total | $12,863 | ≈ $1,072 |
Parking and tolls aren't included, and actual costs swing widely by vehicle, state, and driver — pickups ran about $1.10 a mile in AAA's study versus about $0.62 for small sedans.
Tip
Don't add the loan payment and depreciation — that counts the car twice. The principal part of each payment is buying the car; depreciation is how much of that purchase is being used up. The true economic cost is depreciation + interest + running costs. The payment + running costs is the monthly cash cost. Both are useful; they answer different questions.
Depreciation: the biggest cost nobody bills you for
Depreciation is money the owner effectively loses even if the car is never in an accident and nothing ever breaks. It shows up only when the car is sold, traded in, or totaled — which is exactly why it's so easy to ignore while it's quietly the largest cost of ownership.
A few reasons the loss tends to be steepest early:
- The "new car" premium disappears fast. A large part of a new vehicle's price reflects being unused and covered by a full factory warranty; both of those start fading the moment it's driven off the lot.
- The first owner absorbs the steepest decline. It's widely observed that new vehicles tend to lose value fastest in the first year or two, with the pace of decline slowing after that — though the exact curve varies a lot by make, model, mileage, and market conditions.
- Newer model years keep arriving. Each new model year, updated features, or redesign makes the previous year's version look comparatively older, pressuring resale prices.
- Mileage and wear compound the effect. Higher mileage and visible wear reduce value further, independent of the age of the vehicle.
Because it happens gradually and invisibly, depreciation rarely shows up in anyone's monthly budget — yet at about $4,422 a year in AAA's 2026 numbers, it costs more than fuel or insurance on its own — nearly as much as the two combined.
New, used, or lease: trade-offs, not verdicts
Each path shifts costs and risks around rather than eliminating them.
| Option | Where it tends to help | Where it tends to cost |
|---|---|---|
| Buying new | Full factory warranty, latest safety features, no unknown history | Absorbs the steepest depreciation firsthand; typically the highest purchase price |
| Buying used | Someone else already absorbed the early depreciation hit; lower purchase price | Warranty coverage may be shorter or absent; maintenance history can be uncertain |
| Leasing | Often a lower monthly payment; usually stays under warranty the whole time | No ownership equity at the end; mileage limits and wear-and-tear charges can apply |
None of these is a universal best choice. The right trade-off depends on how long a vehicle tends to be kept, how many miles are driven per year, tolerance for uncertainty about a used vehicle's history, and whether building ownership equity matters to the household.

Rules of thumb for what share of income goes to a car
A few heuristics circulate in personal-finance discussions as rough starting points, not precise formulas.
- The 20/4/10 idea: roughly 20% down, a loan term of four years or less, and total car costs (payment plus insurance) no more than about 10% of gross income.
- A broader transportation ceiling: some budgets aim to keep all transportation costs — payment, insurance, fuel, maintenance, parking — under a set share of take-home pay, often cited in the 10-15% range.
Watch out
Where these rules of thumb break down:
- They don't adjust for regional cost differences — insurance, parking, and even gas prices vary sharply by state and city.
- They ignore that a reliable car may be a necessity, not a discretionary purchase, regardless of what the percentage suggests.
- They usually count only the payment and insurance, not the full list of costs above — a car that fits the rule on paper can still stretch a budget once maintenance and depreciation are counted.
- They don't account for income variability — a rule that works on a stable salary may not fit irregular or seasonal income.
These guidelines can be useful for a gut check, but they work best paired with an honest look at the actual, full monthly cost — not just the payment.
Why a longer loan term cuts the payment but raises the risk
Stretching a loan over more months lowers the payment because the same amount borrowed is divided across more payments — but interest keeps accruing the whole time, so a longer term generally means paying more in total interest, even at the same rate.
It also raises a specific risk: because a car's value often drops fastest early on while a long loan's balance declines slowly at first, there can be a stretch of time where the amount owed is higher than the car is worth. This is sometimes called negative equity It matters most if the car needs to be sold, traded in, or is declared a total loss before the loan and the car's value have caught up with each other.
Worked example
Illustrative numbers.
Assumptions: $30,000 loan amount, 6% annual interest rate (APR), comparing a 4-year (48-month) term to a 7-year (84-month) term, using a standard loan amortization formula.
| Loan term | Monthly payment (example) | Total interest paid over the loan (example) |
|---|---|---|
| 4 years (48 months) | ≈ $705 | ≈ $3,820 |
| 7 years (84 months) | ≈ $438 | ≈ $6,810 |
Stretching the same $30,000 loan from 4 to 7 years cuts the monthly payment by close to 40%, but raises the total interest paid by nearly 80%.
Here's the negative-equity mechanic in the same example: on the 7-year loan, the balance remaining after 24 payments would be roughly $22,700 (calculated from the loan's amortization schedule). If the car's actual market value at that point happened to be lower than that — plausible for many vehicles two years in — the owner would be in a position of owing more than the car is worth. That's the mechanical result of a slow-declining loan balance paired with a faster-declining asset value. (The 4-year loan's balance at the same point would be about $15,900.)
Where negative equity bites
- It's common. Edmunds reported that 29.6% of trade-ins toward new vehicles in the second quarter of 2026 carried negative equity, averaging $6,884.
- It usually gets rolled into the next loan. Dealers can add the unpaid balance to the new car's financing, so the next loan starts even further underwater.
- A total loss can leave a bill. Standard insurance pays roughly the car's market value, not the loan balance. Gap insurance exists to cover that difference.
Note
New for tax years 2025–2028: interest on a loan for a new vehicle whose final assembly was in the U.S. may be deductible — up to $10,000 a year, even without itemizing, with the benefit phasing out above $100,000 of modified adjusted gross income ($200,000 for joint filers), per IRS guidance. Leases and used cars don't qualify. Eligibility details matter, so this is one to check with a tax professional.
Key point
A lower monthly payment from a longer term isn't free — it's usually paid for with more total interest and a longer stretch of time where the loan balance can outpace the car's value.
Seeing the loan payment next to insurance, fuel, maintenance, and the rest — instead of in isolation — tends to make the real monthly cost a lot less surprising. A budgeting tool that groups recurring costs like these together can make that fuller picture easier to see at a glance.
FAQ
What percentage of income should go toward a car?
Some commonly cited rules of thumb suggest keeping total car-related costs to roughly 10-15% of take-home pay, but these are starting points, not formulas — they don't account for location, income level, or how essential the car is.
Is leasing cheaper than buying?
Leasing often has a lower monthly payment than financing a purchase, but the lessee builds no ownership equity and may face mileage or wear charges, so the cheaper option depends on how long the vehicle is kept and how it's driven.
How much does a new car really depreciate in the first year?
New vehicles are widely observed to lose value fastest in the first year or two of ownership, with the pace slowing afterward, though the exact amount varies by make, model, mileage, and market conditions.
Does a longer loan term save money overall?
A longer term lowers the monthly payment but generally increases the total interest paid over the life of the loan, since interest accrues for more months on a slower-declining balance.
What does it mean to owe more than a car is worth?
This is sometimes called negative equity — the loan balance is higher than the vehicle's resale or trade-in value, which is more likely with longer loan terms or smaller down payments combined with normal depreciation.
Related reading
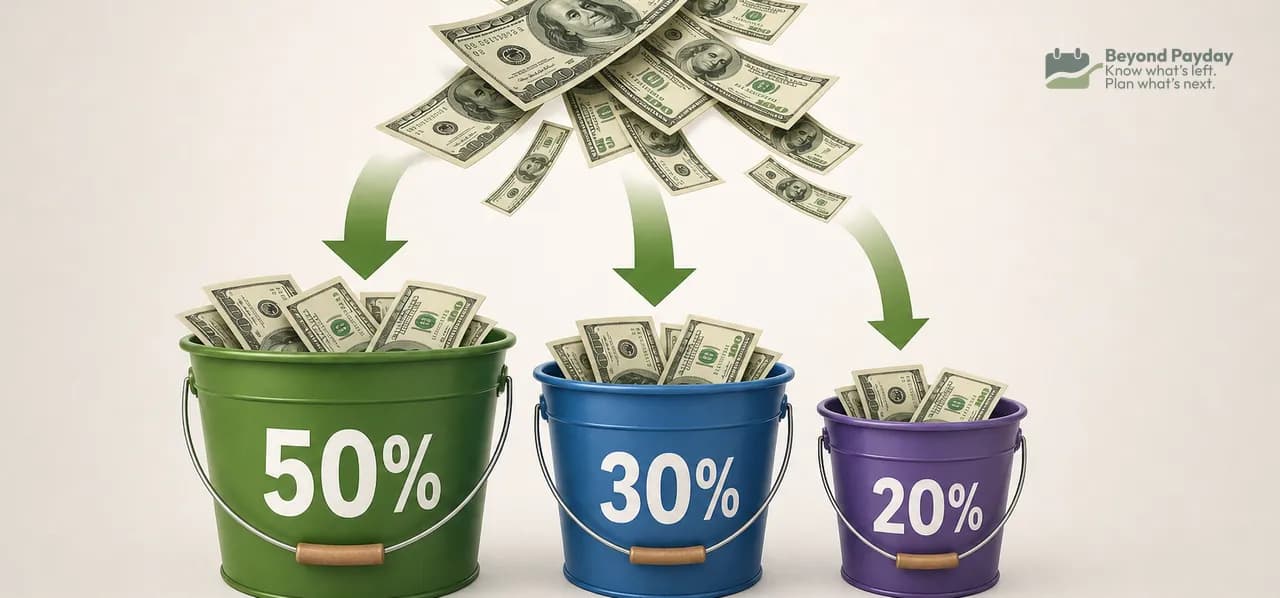
The 50/30/20 budget rule, explained
The 50/30/20 rule splits your take-home pay into needs, wants, and savings. Here's exactly how the math works, a full example, and where the rule breaks down.

How to make a budget that actually works
A budget only works if it matches your real income, splits fixed from variable costs, and runs on autopilot. Here's the step-by-step process.

Assets vs liabilities: what actually counts?
An asset is what you own, a liability is what you owe — but real life has gray areas: cars, houses, and "good debt" all complicate the simple version.
Beyond Payday is a planning tool, not a financial advisor. This article is educational — projections and examples are estimates, not financial, tax, or investment advice.